Imbalanced data (01/02)
Table of contents
What is an imbalanced dataset and is it a problem in ML?
Machine Learning (ML) algorithms are designed to minimize errors and optimize relevant evaluation metrics (e.g., accuracy). However, these metrics can vary widely depending on the application and the specific goals of the ML model. For example, while accuracy might be a key metric for a specific classification problem, other tasks might prioritize metrics such as precision and recall, F1 score, area under the ROC curve (AUC-ROC), mean squared error (MSE) for regression tasks, or even more complex, custom-made metrics designed for specific applications.
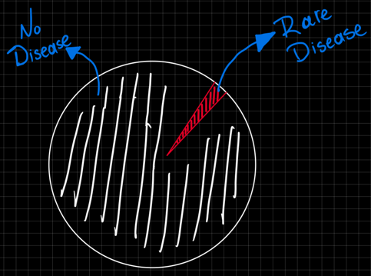
An imbalanced dataset refers to the situation where the number of observations is not evenly distributed (or near to evenly) among the different classes. In other words, the distribution of samples across the different classes is not uniform.
Such datasets, can significantly skew the performance of classification algorithms, but this is a reality in many common real life use cases such as fraud detection where non-fraudulent transactions (majority class) almost always outnumber the fraudulent (minority class). Similar problems arise in medical situations where a patient might be having a rare disease.
Note: Class imbalance is not a one-off thing, it may evolve/shift over time in any direction. Nothing is static in the real world.
Interesting. Tell me more.
In the medical example above, as well as in other scenarios, the minority class might be way more significant than its majority counterpart. While the rare disease makes up only 1% of the data, it's crucial to remember that even a small percentage can translate to a significant number of people in the real life.
What if your model is performing well on your metrics but underperforms in reality. To put this into context, imagine we're developing a machine learning model that is designed to detect a rare disease given the above dataset. The model assigns a probability of 75% the patient actually having the rare disease, which seems convincing on the surface.
In a perfectly calibrated model, a 75% probability would indicate that the new patient has a 75% chance of that rare disease. Due to imbalanced data however, the model might just be overconfident in it's "No disease" predictions. Instead of using accuracy as a metric here, reframing the problem or using different evaluation metrics might be a better approach.
A 75% score might actually translate to a much lower chance of the rare disease (e.g., only 40% or 50%) with the remaining 25% representing the model's bias towards "no disease". In fact, in such scenarios, knowing the uncertainty is as important as the prediction itself.
The doctor, relying solely on the 75% score, might gift you an answer like:

Moreover, there are problems where our main interest lies in understanding why B is happening rather than how accurately can we predict A and this is when imbalanced data becomes a big problem as it is very hard to convince your method that it can predict better than 99%.
What can we do about it?
Good question. There are many variables in this equation.
As mentioned in the beginning, algorithms’ objectives are to minimize an error and are generally designed on having balanced class distributions. They get a bit fuzzy otherwise.
Literature is not that good of a friend here either.
There are a variety of methods available that try to handle imbalanced data. The hard part is finding which ones work. Famous techniques may include
-
Random oversampling/undersampling or a combination of both
-
SMOTE
-
ADASYN
-
ENN
-
Tomek links
as well as more custom approaches such as ensemble resampling.
Although such techniques may indeed help with the distribution of the data, they don’t always prove to improve model performance.
This can be a good reason why SMOTE was very rarely used in Kaggle’s winning solutions. Wait, what?
Let me stop right here. See you on the next part.